You know the adage, “A picture is worth a thousand words.” For me, that phrase beautifully summarizes our understanding of the power of a good image.
This is especially true in data science, where visuals can play a substantial role in decision-making, telling stories, sharing findings and many more.
But, if you are wondering what libraries will help your projects shine with a different light in the eyes of hiring managers or recruiters, I have your back.
I gathered three remarkable libraries for you to use to help with your projects and let the visuals speak about your amazing skills in data science.
Each library below has a range of unique capabilities specific to creating static, animated, and interactive visualizations.
- Vega-Altair
- Matplotlib Widgets
- Bokeh
So you will have a variety of options to choose from for your specific project.
And now, without further ado, let’s dive in.
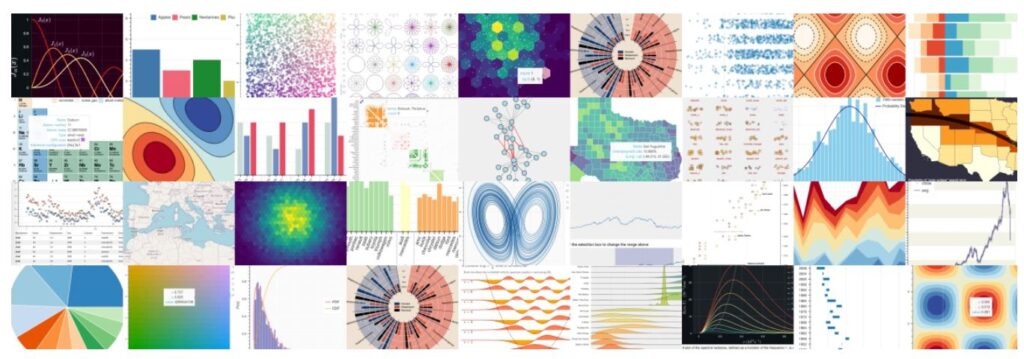
Vega-Altair
Vega-Altair is a declarative statistical visualization library for Python.
With Vega-Altair, you can spend more time understanding your data and its meaning and create beautiful and effective visualizations with a minimal amount of code.
I personally love this option, not only because of its simplicity but because of the Wow effect I get with their Interactive Charts.
I mean, look at that impressive interactive graph 😍😍
Matplotlib Widgets
You have probably heard about Matplotlib. It is a comprehensive library for creating static, animated, and interactive visualizations.
But what you probably have yet to hear of is the amazing widgets that allow you to create interactive plots.
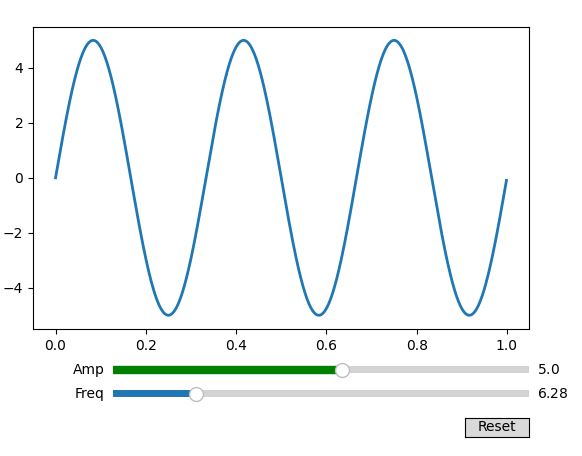
I mean, who doesn’t enjoy adjustable sliders? 😉
Bokeh
Bokeh is a Python library that creates interactive visualizations for modern web browsers. It helps you build beautiful graphics, ranging from simple plots to complex dashboards with streaming datasets. With Bokeh, you can create JavaScript-powered visualizations without writing any JavaScript yourself.
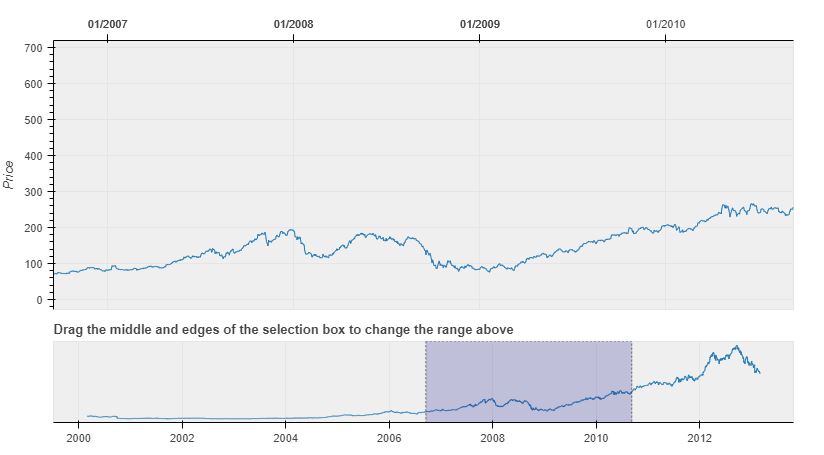
Offering plots with beautiful colors and the advantage of experimenting with interactive notebooks to test with all elements of Bokeh.
I mean, look at this beautiful color and variety of options 😍
I hope you enjoyed today’s posts, and if you end up using any of these libraries, please let me know which one you prefer.
Quote of the week
The secret of change is to focus all of your energy, not on fighting the old, but on building the new. – Socrates